 PARP Research Group
 PARP Research Group PARP Research Group |
Universidad de Murcia  |
QVCPUPlot Class Reference
|
Class for plot graphs of block's cpustat properties.
This class lets us plot graphs for QVStat block's output properties. Each QVProcessingBlock object is created with a property containing a stat object, resuming its time consumption and internal statistics. The class QVCPUPlot can be used to plot those time statistics.
The following code features how to create a CPU plot object in a QVision application:
void main()
        {
        [...]
        ComponentTreeBlock componentTreeBlock("Component Tree");
        CannyBlock cannyBlock("Canny operator");
        ContourPainter contourPainter("Contour painter");
        [...]
        QVCPUPlot cpuPlot("CPU Plot", true, 10);
        componentTreeBlock.linkProperty("cpu stats", cpuPlot);
        cannyBlock.linkProperty("cpu stats", cpuPlot);
        contourPainter.linkProperty("cpu stats", cpuPlot);
        [...]
        }
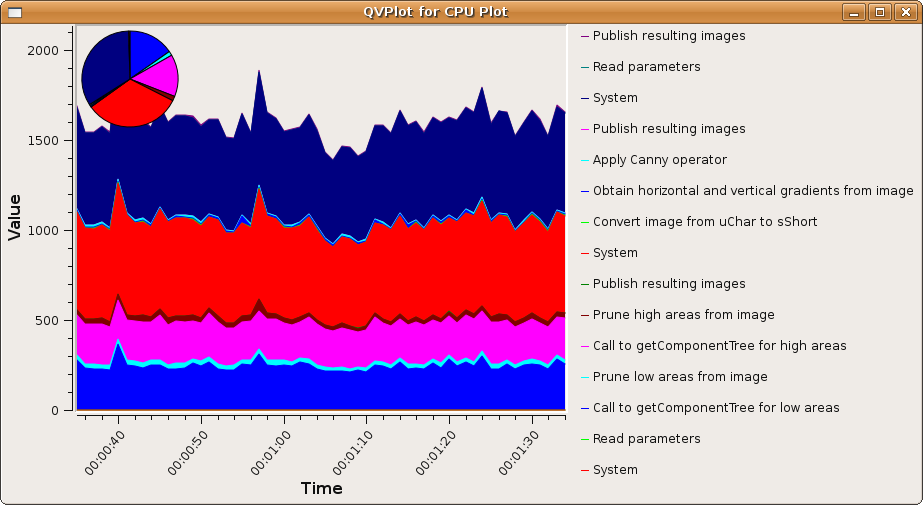
This application will display a plot like the following:

By default, the QVDefaultGUI includes the following button for CPU plot statistics displaying, which opens a QVNumericPlot widget plotting the block CPU usage:
