 PARP Research Group
 PARP Research Group PARP Research Group |
Universidad de Murcia  |
QVHistogramPlot Class Reference
| |||||||||||||||||||||||||||||||||||||||||||||||||||||||||||||||||||||||||||||||||||||||
Public Member Functions | |
| QVHistogramPlot (const QString name=QString(), bool time=true, int step=10, double maxim=0, double minim=0, QWidget *parent=0) | |
| Constructs a QVHistogramPlot with a given string identifier, and a iteration's parameters. Construct a new plot that shows QList<double> properties graphs as an histogram graph. This plot shows decorations, it hasn't got a pie graph, don't brush the data and autoshow. It can show graphs of QList<double> linked properties of different blocks. | |
Protected Member Functions | |
| bool | linkUnspecifiedInputProperty (QVPropertyContainer *sourceContainer, QString sourcePropName, LinkType linkType=AsynchronousLink) |
| Links properties from blocks. This method safely links properties from blocks in a thread safe manner. If the iterations are based on block's iterations (time == false), the block must be synchronised with previous linked blocks. Only can be linked QList<double> properties. | |
Widget for plotting QList<double> property values from a block, as an histogram, over the time.
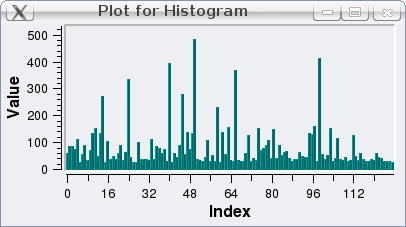
Class QVHistogramPlot shows a widget which will read a QList<double> from a block's output property, and will continuously plot its evolution in time during block execution.
The abscissas axis will correspond to the QList size, while the ordinate axis will scale to the maximum value of the double values in the list read from the block.
To show the usage of the class, we need again a block which produces the QList<double> of values to be plotted. The following code shows an example:
class MyBlock: public QVProcessingBlock
        {
        public:
                MyBlock(QString name): QVProcessingBlock(name)
                        {
                        addProperty<QList<double> >("histogram", outputFlag);
                        [...]
                        }

                void iterate()
                        {
                        QList<double> histogram;
                        [...]
                        // Calculate values for the 'histogram' variable.
                        [...]
                        setPropertyValue<QList<double> >("histogram", histogram);
                        [...]
                        }
        }
And then, in the main function, we can create a QVHistogramPlot and link it with that property, like this:
#include <QVHistogramPlot>

void main()
        {
        [...]
        MyBlock myBlock("block");
        QVHistogramPlot histPlot("Histogram", false, 1);
        myBlock.linkProperty(histPlot,"histogram");
        [...]
        }
The result will be an application showing the following window widget:

The second and third parameters in the constructor of the QVListPlot correspond to time (true) or iteration (false) based operation, and the refreshing interval (in hundreths of seconds, in the first case, or in absolute number of iterations, in the second case).
Definition at line 92 of file qvhistogramplot.h.
| QVHistogramPlot::QVHistogramPlot | ( | const QString | name = QString (), |
|
| bool | time = true, |
|||
| int | step = 10, |
|||
| double | maxim = 0, |
|||
| double | minim = 0, |
|||
| QWidget * | parent = 0 | |||
| ) |
Constructs a QVHistogramPlot with a given string identifier, and a iteration's parameters. Construct a new plot that shows QList<double> properties graphs as an histogram graph. This plot shows decorations, it hasn't got a pie graph, don't brush the data and autoshow. It can show graphs of QList<double> linked properties of different blocks.
| name | Identifier for the object to be created. | |
| time | True if the iterations are based on clock time (in second hundredths), and false if they are based on block's iterations. | |
| step | Set the base measure to plot's iterations ratio. | |
| maxim | The left axis maximum value shown, if it is 0, the maximum value is auto scale. | |
| minim | The left axis minimum value shown, it must be less than maximum value. | |
| parent | Identifier for the parent widget. |
Definition at line 35 of file qvhistogramplot.cpp.
| bool QVHistogramPlot::linkUnspecifiedInputProperty | ( | QVPropertyContainer * | sourceContainer, | |
| QString | sourcePropName, | |||
| LinkType | linkType = AsynchronousLink | |||
| ) | [protected] |
Links properties from blocks. This method safely links properties from blocks in a thread safe manner. If the iterations are based on block's iterations (time == false), the block must be synchronised with previous linked blocks. Only can be linked QList<double> properties.
See also QVPropertyContainer::LinkType.
| sourceContainer | The container that whants to be linked. | |
| sourcePropName | The name of the source property to be linked. | |
| linkType | The link's type. |
Definition at line 45 of file qvhistogramplot.cpp.