 PARP Research Group
 PARP Research Group PARP Research Group |
Universidad de Murcia  |
QVNumericPlot Class Reference
|
Class for plot graphs of block's int or double properties.
Class QVNumericPlot shows a widget which will read a set of integer or double values and plot their time evolution during the corresponding block execution.
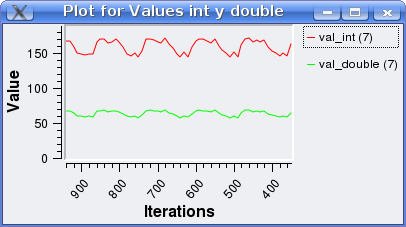
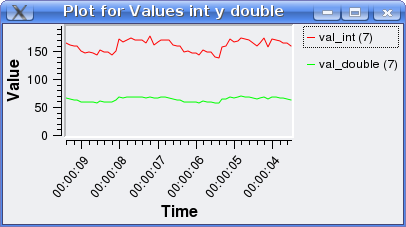
The abscissa axis will display the number of iterations (or the number of elapsed seconds, depending on the boolean time parameter of the constructor QVNumericPlot::QVNumericPlot ). The ordinate axis will scale to the maximum value of the integer or double values read from the block (or blocks) in the time interval displayed. One QVNumericPlot widget can read integer or double values from several blocks, but obviously, for this to work correctly, either a) the blocks must be synchronized, or b) the QVNumericPlot should display the elapsed time in the abscissa axis (not the number of iterations).
To show the usage of the class, first we need a block that produces some integer or double output values which we are interested in monitoring. The following code shows an example:
class MyBlock: public QVProcessingBlock
        {
        public:
                MyBlock(QString name): QVProcessingBlock(name)
                        {
                        addProperty<int>("val_int", outputFlag);
                        addProperty<double>("val_double", outputFlag);
                        [...]
                        }

                void iterate()
                        {
                        int     val_int;
                        double  val_double;
                        [...]
                        // Calculate values for 'val_int' and 'val_double' variables.
                        [...]
                        setPropertyValue<int>("val_int", val_int);
                        setPropertyValue<double>("val_double", val_double);
                        [...]
                        }
        }
And then, in the main function, we can create a QVNumericPlot object and link it with those properties, like this:
#include <QVNumericPlot>

void main()
        {
        [...]
        MyBlock myBlock("block");
        QVNumericPlot numericPlot("Values int y double",false);
        myBlock.linkProperty("val_int",numericPlot);
        myBlock.linkProperty("val_double",numericPlot);
        [...]
        }
The result will be an application showing the following window widget:

If the numeric plot would have been declared with true as last parameter (instead of false), then the abscissas axis would show time in seconds (instead of number of iterations), like this:
