 PARP Research Group
| PARP Research Group |
Universidad de Murcia |
QVFunctionPlot Class Reference
| |||||||||||||||||||||||||||||||||||||||||||||||||||||||||||||||||||||||||||||||
Public Member Functions | |
| QVFunctionPlot (const QString name=QString(), bool time=true, int step=10, QWidget *parent=0) | |
| Constructs a QVFunctionPlot with a given string identifier, and a iteration's parameters. Construct a new plot that shows QList<double> properties graphs as an histogram graph. This plot shows decorations, it hasn't got a pie graph, don't brush the data and autoshow. It can show graphs of QList<double> linked properties of different blocks. | |
Protected Member Functions | |
| bool | linkUnspecifiedInputProperty (QVPropertyContainer *sourceContainer, QString sourcePropName, LinkType linkType=AsynchronousLink) |
| Links properties from blocks. This method safely links properties from blocks in a thread safe manner. If the iterations are based on block's iterations (time == false), the block must be synchronised with previous linked blocks. Only can be linked QList<double> properties. | |
Widget for plotting QList<double> property values from a block, as an histogram, over the time.
This class creates a widget which plots some arrays of values as functions:
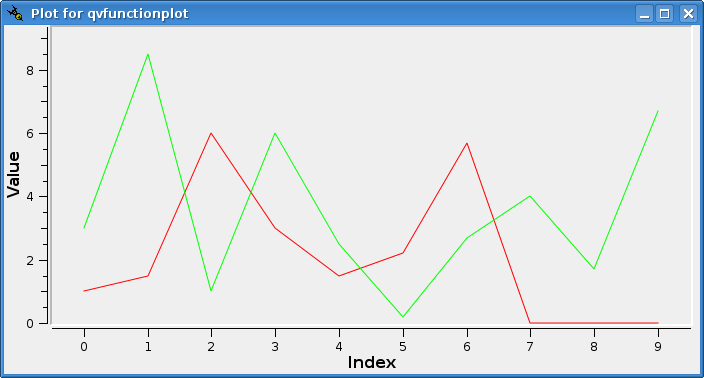
For further information about its usage and functionality see section QVFunctionPlotWidget
Definition at line 48 of file qvfunctionplot.h.
| QVFunctionPlot::QVFunctionPlot | ( | const QString | name = QString (), |
|
| bool | time = true, |
|||
| int | step = 10, |
|||
| QWidget * | parent = 0 | |||
| ) |
Constructs a QVFunctionPlot with a given string identifier, and a iteration's parameters. Construct a new plot that shows QList<double> properties graphs as an histogram graph. This plot shows decorations, it hasn't got a pie graph, don't brush the data and autoshow. It can show graphs of QList<double> linked properties of different blocks.
| name | Identifier for the object to be created. | |
| time | True if the iterations are based on clock time (in second hundredths), and false if they are based on block's iterations. | |
| step | Set the base measure to plot's iterations ratio. | |
| maxim | The left axis maximum value shown, if it is 0, the maximum value is auto scale. | |
| minim | The left axis minimum value shown, it must be less than maximum value. | |
| parent | Identifier for the parent widget. |
Definition at line 35 of file qvfunctionplot.cpp.
| bool QVFunctionPlot::linkUnspecifiedInputProperty | ( | QVPropertyContainer * | sourceContainer, | |
| QString | sourcePropName, | |||
| LinkType | linkType = AsynchronousLink | |||
| ) | [protected] |
Links properties from blocks. This method safely links properties from blocks in a thread safe manner. If the iterations are based on block's iterations (time == false), the block must be synchronised with previous linked blocks. Only can be linked QList<double> properties.
See also QVPropertyContainer::LinkType.
| sourceContainer | The container that whants to be linked. | |
| sourcePropName | The name of the source property to be linked. | |
| linkType | The link's type. |
Definition at line 44 of file qvfunctionplot.cpp.